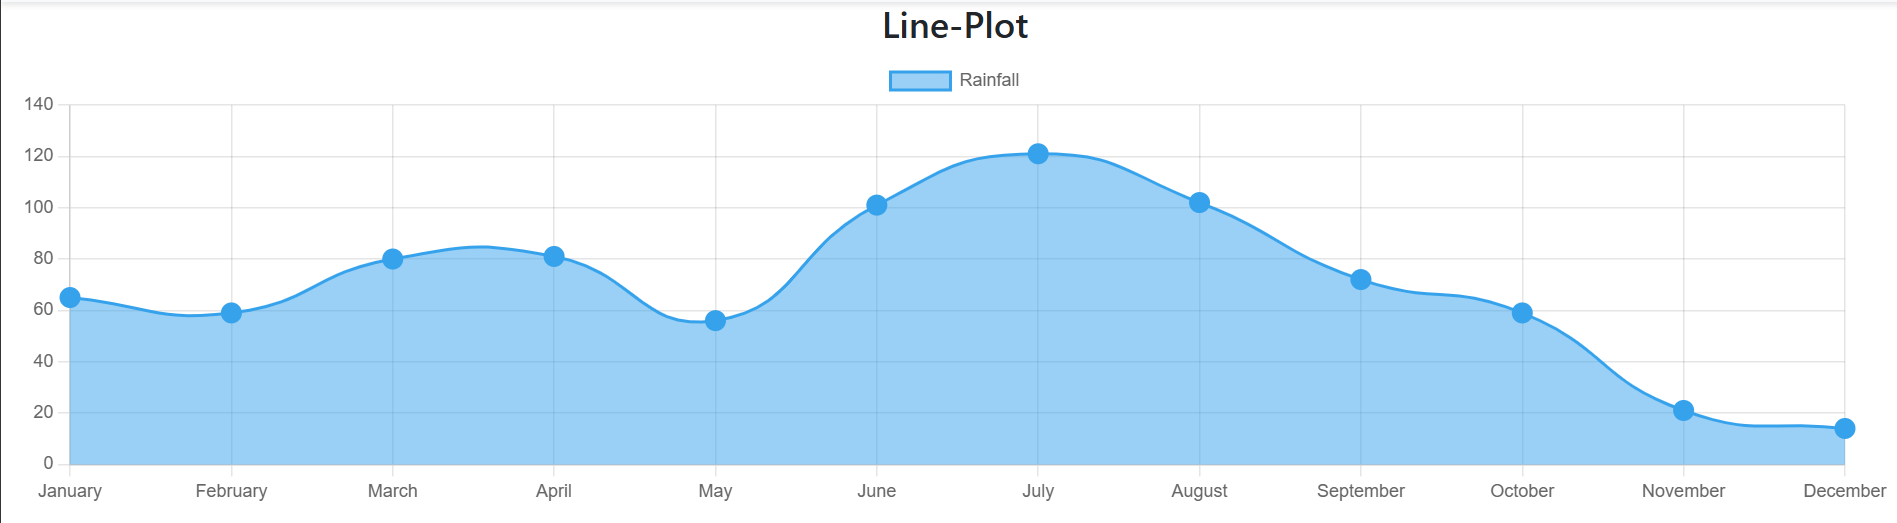
Line-Plot
import { Line } from "react-chartjs-2";
// Chart is imported to avoid error "category is not a registered scale"
import Chart from "chart.js/auto";

const data = {
    labels: ['January', 'February', 'March', 'April', 'May', 'June', 'July', 'August', 'September', 'October', 'November', 'December'],
    datasets: [
        {
            label: 'Rainfall',
            data: [65, 59, 80, 81, 56, 101, 121, 102, 72, 59, 21, 14],
            lineTension: 0.5, // 0 for Straight line, Increase it to make line curve
            fill: true,// Area under curve is highlighted
            borderWidth: 2,
            pointBorderWidth: 8,
            pointHoverRadius: 8,
            pointHoverBorderWidth: 3,
            pointRadius: 3,
        }
    ]
}
const options = {
    responsive: true,
    maintainAspectRatio: false,
    legend: {
        position: "none"
    },

}

function TrendPlot() {
    return (
        <div>
            <h4 className='light_text' style={{ textAlign: "center" }}>Line-Plot</h4>
            <div className='container-fluid light_text' >
                <Line data={data} options={options} height="300px" />
            </div>

        </div>
    )
}

export { TrendPlot };
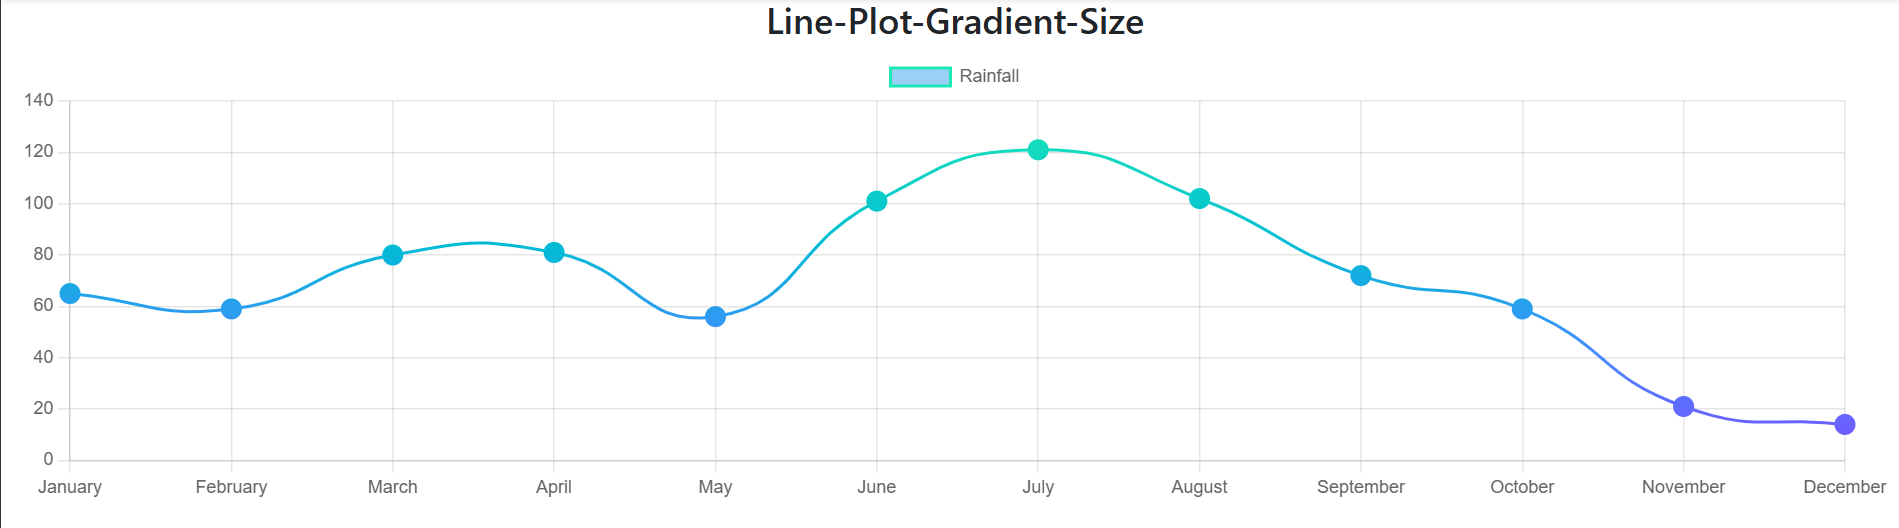
Line-Plot With Gradient
import { Line } from "react-chartjs-2";
// Chart is imported to avoid error "category is not a registered scale"
import Chart from "chart.js/auto";
import { useState, useEffect, useRef } from "react";

//Intial Configurations
const data = {
  labels: ['January', 'February', 'March', 'April', 'May'],
  datasets: [
      {
          label: 'Rainfall',
          data: [65, 59, 80, 81, 56]
      }
  ]
}
const options = {
  responsive: true,
  maintainAspectRatio: false,
  legend: {
    position: "none"
  },
}

function TrendPlot() {
  const chartElement = useRef();
  const [chartData, set_chartData] = useState(data);

  // We need the component to render first, in order for reference 'chartElement' to set properly.
  useEffect(() => {
    fill_chart_data();
  }, [])

  function createGradient(ctx, area) {
    const gradientStroke = ctx.createLinearGradient(0, area.bottom, 0, area.top);
    var first_color_combo = ["#F44336", "#F50057", "#FF4081", "#FF9100"];
    var second_color_combo = ["#7C4DFF", "#448AFF", "#00BCD4", "#1DE9B6"];
    var basic_color_combo = ['red', 'yellow', 'blue', 'green'];

    var color = second_color_combo; // Try
    // Describe Gradient
    // Pure-Color[0](0%) --> Pure-Color[1](30%) --> Pure-Color[2](60%) --> Pure-Color[3](100%)
    gradientStroke.addColorStop(0, color[0]);
    gradientStroke.addColorStop(0.3, color[1]);
    gradientStroke.addColorStop(0.6, color[2]);
    gradientStroke.addColorStop(1, color[3]);

    return gradientStroke;
  }

  function fill_chart_data() {
    // ChartElement reference is used to generate Gradient, Therefore component need to render first with dummy data
    var gradientStroke = createGradient(chartElement.current.ctx, chartElement.current.chartArea);
    const data = {
        labels: ['January', 'February', 'March', 'April', 'May', 'June', 'July', 'August', 'September', 'October', 'November', 'December'],
        datasets: [
          {
            label: 'Rainfall',
            data: [65, 59, 80, 81, 56, 101, 121, 102, 72, 59, 21, 14],
            lineTension: 0.5, // 0 for Straight line, Increase it to make line curve
            fill: false,// Area under curve is highlighted
            borderWidth: 2,
            pointBorderWidth: 8,
            pointHoverRadius: 8,
            pointHoverBorderWidth: 3,
            pointRadius: 3,
            // Gradient-Related
            borderColor: gradientStroke,
            pointBorderColor: gradientStroke,
            pointBackgroundColor: gradientStroke,
            pointHoverBackgroundColor: gradientStroke,
            pointHoverBorderColor: gradientStroke,
          }
        ]
    }
    set_chartData(data);
}


  return (
    <div>
      <h4 className='light_text' style={{ textAlign: "center" }}>Line-Plot-Gradient-Size</h4>
      <div className='container-fluid light_text' >
        <Line ref={chartElement} data={chartData} options={options} height="300px" />
      </div>
    </div>
  )
}

export { TrendPlot };